A Guide to Client Success Metrics That Drive Growth
A practical guide to the client success metrics that actually drive growth. Learn how to track retention, revenue, and customer health to scale your business.

Client success metrics give you a clear, honest look at the health of your business. They go beyond simple satisfaction scores, showing you how customers are using your product, where they're finding value, and when they might be on the verge of leaving.
Think of them less like a report card and more like a roadmap for sustainable growth.
Why Client Success Metrics Are a Growth Engine
Tracking client success is no longer a passive support function. It's an active growth strategy. These metrics give you the data you need to make proactive decisions that directly grow your bottom line. Instead of guessing why customers are leaving, you can spot the warning signs early and step in.
When you start measuring the right things, you can:
- Predict Future Revenue: Get a real sense of which accounts are likely to renew, upgrade, or churn.
- Reduce Customer Churn: Pinpoint at-risk customers and act on their issues before they walk away.
- Identify Expansion Opportunities: Find your happiest, most successful clients and find opportunities for upselling or cross-selling.
Shifting from Support to Strategy
The role of customer success has fundamentally changed. It’s now seen as a core driver of business growth, tied directly to sales and marketing. This shift creates a much smoother customer journey, which in turn improves both retention and revenue.
By 2025, personalized customer success, powered by AI and analytics, is expected to be the norm. This will allow companies to deliver highly specific experiences that build strong loyalty. You can look into more of these customer success trends on Statisfy.com.
The core idea is simple: A successful customer is a loyal customer. When your clients achieve their goals using your product or service, they are more likely to stay with you, spend more over time, and recommend you to others.
This proactive approach turns your customer base into your single most powerful asset for growth. It moves your team from a reactive, problem-solving mode to a strategic, value-adding one. In the end, strong client success metrics are the foundation for building a healthier, more profitable business.
The Foundational Metrics Every Business Should Track
To get a real handle on your client relationships, you need to look at two different kinds of client success metrics. Think of them as leading and lagging indicators.
Leading indicators are like checking the weather forecast before a trip; they give you a sense of what's likely to happen down the road. Lagging indicators are like looking at photos after the trip; they tell you exactly what went down.
Leading indicators, like product adoption or client engagement scores, are your early warning system. They help you predict what’s coming and step in before a small hiccup turns into a major problem. A sudden drop in a client's engagement, for instance, is a huge red flag that they might be losing interest or struggling with your product.
Lagging indicators, on the other hand, measure what’s already happened. Metrics like churn rate and renewal rate are the ultimate proof of your success or failure. While they confirm past events, they give you the hard data you need on the health of your customer base and whether your strategies are actually working.
Leading Indicators: Your Early Warning System
Leading indicators give you a real-time pulse on client health. They’re predictive, helping you spot potential trouble long before it shows up in your revenue numbers.
Product Adoption Rate: This metric shows how much of your product or service a client is actually using. Think of it like a new gym membership. If someone only ever uses the treadmill and ignores all the other equipment, their adoption rate is low. A low rate suggests they aren't getting the full value, making them a much higher risk for churn.
Client Engagement Score: This is a custom score you create by combining several actions, like logins, feature usage, and support ticket submissions. It’s basically a credit score for client health. A high score points to a healthy, active relationship, while a dropping score is a clear signal that requires immediate attention.
This is the kind of data a product manager might track on a central dashboard to get a unified view of what's going on.
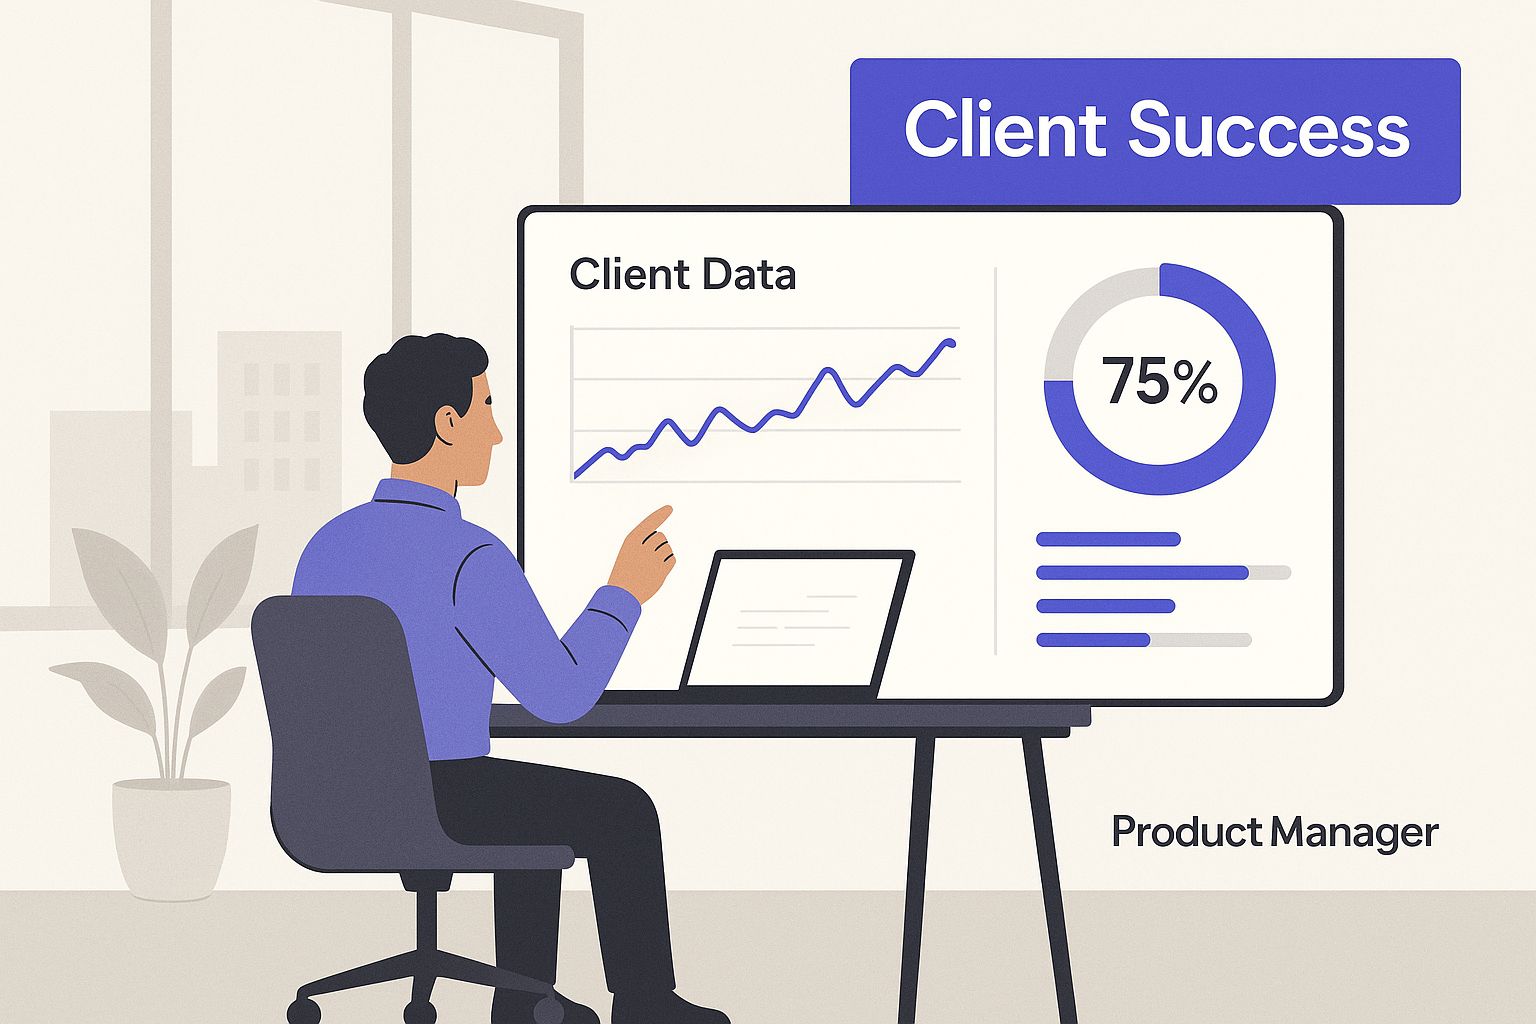
Having everything in one place like this is a key part of making smart, informed decisions quickly.
Lagging Indicators: Measuring What Happened
While leading indicators predict the future, lagging indicators confirm it. These metrics give you concrete proof of your performance over a specific period. These are the numbers your leadership team will want to see.
A huge part of measuring past performance is tracking direct customer feedback. This is absolutely vital for any company trying to improve satisfaction and loyalty. Metrics like the Customer Satisfaction Score (CSAT), churn rate, and Customer Lifetime Value (CLV) are important here. CSAT directly measures happiness in the moment, while churn and CLV paint a clear picture of retention and long-term profitability.
A successful client relationship is not just about stopping churn; it’s about creating an environment where clients thrive, expand their usage, and turn into advocates for your brand.
Knowing these lagging metrics helps you prove the financial impact of your client success efforts. For example, a low churn rate translates directly to predictable recurring revenue. Learning how to effectively start analyzing customer feedback is a key skill for improving these numbers over time.
Key Client Success Metrics at a Glance
To help you keep track, here's a quick breakdown of the most important client success metrics, what they measure, and why they should be on your radar.
By tracking a balanced mix of both leading and lagging indicators, you get the full story. You can see where your clients are headed and know the results of where you've been. This dual focus is what allows you to build a proactive, data-informed client success strategy that actually works.
Measuring the Financial Impact of Client Success
Happy clients are great, but how does their success actually hit your bottom line? This is where financial client success metrics come into play. They draw a straight line from the health of your client relationships to your revenue, giving you a powerful way to show leadership the real value of your work.
These numbers go beyond simple satisfaction scores. They show exactly how retaining and growing accounts contributes to the company's financial stability. When you dig into the financial side of client acquisition, for example, it becomes important to know how to squeeze every drop of value from your marketing spend. For any business running paid ads, knowing things like optimizing ad campaigns for high ROI provides helpful context for the entire financial picture.
Gross vs. Net Revenue Retention
Two of the most important financial metrics you’ll ever track are Gross Revenue Retention (GRR) and Net Revenue Retention (NRR). They sound similar, but they tell two completely different stories about your business's health.
Gross Revenue Retention (GRR) is all about your ability to hold onto the revenue you already have. It takes your starting monthly recurring revenue (MRR), then subtracts any revenue you lost from clients who canceled or downgraded (churn). GRR ignores any expansion revenue from upsells or cross-sells.
GRR Formula: ((Starting MRR - Churn & Downgrade MRR) / Starting MRR) x 100
A high GRR is a sign that your core product is sticky. It means clients are getting value and sticking around. Think of it as the purest measure of retention.
On the other hand, Net Revenue Retention (NRR) takes GRR a step further. It also starts with your MRR and subtracts churn, but then it adds back any expansion revenue from existing clients who upgraded or bought more from you.
NRR Formula: ((Starting MRR - Churn & Downgrade MRR + Expansion MRR) / Starting MRR) x 100
An NRR over 100% is a massive win. It means the growth from your existing customer base is more than making up for any losses from churn. This is what’s known as "negative churn," and it's a major goal for most SaaS businesses.
Why You Absolutely Need Both Metrics
You can’t just track NRR and call it a day, because NRR alone can hide some serious problems. Imagine your NRR is a healthy-looking 105%. Awesome, right? But what if your GRR is only 80%? That means you're losing 20% of your customers but covering it up with aggressive upselling. That’s a leaky bucket, and it’s not a sustainable way to grow.
The ideal scenario is a high GRR with an even higher NRR. That shows you're keeping the customers you have and also growing their value over time.
It’s no surprise the global customer success platforms market is projected to hit $3.1 billion by 2026. Technology is making it easier than ever to get a handle on these numbers. In fact, about 93.7% of companies measuring customer success are zeroed in on revenue goals, with GRR and NRR at the top of the list. You can look into more of these customer success statistics from Custify.
Customer Lifetime Value (CLV)
Another financial metric you can't ignore is Customer Lifetime Value (CLV). It’s a forecast of the total revenue you can expect to earn from a single customer over the entire course of their relationship with you.
CLV is what tells you how much you can reasonably spend to acquire a new customer (Customer Acquisition Cost, or CAC) and still turn a profit. A healthy business model always has a CLV that's significantly higher than its CAC. It's the ultimate reality check for your growth strategy.
How to Set Benchmarks for Your Metrics
Tracking client success metrics without context is like watching a scoreboard with no idea what a winning score looks like. Benchmarks give your data meaning, turning abstract numbers into clear targets. They’re what tell you if you’re winning, losing, or just running in place.

Without them, your team is flying blind. You might celebrate a 5% bump in product adoption this month, but if the industry average is 20%, you’re actually falling behind.
Internal vs. External Benchmarking
There are really two ways to look at this: from the inside out and the outside in. Each gives you a totally different, but equally valuable, perspective on your performance.
Internal Benchmarking: This is all about competing with yourself. You compare your current performance to your own past results, like this quarter's churn rate versus the last four quarters. It’s perfect for seeing if your strategies are actually moving the needle.
External Benchmarking: Here, you’re looking over the fence. You compare your numbers to industry averages or even direct competitors. This helps you figure out where you stack up in the market. Knowing that top SaaS companies have a Net Revenue Retention (NRR) over 120% gives you a real, tangible goal to shoot for.
The smartest approach? Use a mix of both. Internal benchmarks track your own improvement, while external benchmarks keep your goals grounded in market reality. This combo stops you from either chasing impossible targets or getting too comfortable with mediocre results.
Creating Your First Benchmarks
Setting your first benchmarks doesn't have to be an overly complicated process. Just start by looking at your own history. Pull the data from the last six or twelve months to establish a baseline. That becomes your first internal benchmark.
From there, you can set small, incremental goals. For instance, if your current Customer Satisfaction (CSAT) score is hovering around 85%, a realistic goal might be to hit 88% next quarter.
Your benchmarks should be dynamic tools for continuous improvement, not a static report card. As your company matures and your strategies evolve, your benchmarks should adjust to reflect new goals and market conditions.
A common mistake is for a small startup to compare its numbers directly to a massive enterprise. Their retention goals are going to look wildly different, and that's okay. Always keep your comparisons relevant to your company's size, industry, and growth stage.
By combining your own historical data with realistic industry standards, you create meaningful benchmarks that actually guide your team toward real progress. And if you’re looking to make data collection easier, integrating customer support automation can help you track these metrics more consistently without the manual lift.
Tools That Help You Track Client Success Metrics
Trying to manually track every single client interaction and data point is a recipe for disaster. It’s like being a sports coach trying to watch every player on the field at the same time; you’re going to miss the most important plays. This is exactly where dedicated software steps in to automate how you monitor client success metrics.
Think of platforms like Chatiant as your command center. It pulls all your scattered data from different tools into one unified view for each client. So, instead of jumping between your CRM, help desk, and product analytics, you get a single dashboard that tells the whole story. This is the key to finally shifting from just putting out fires to proactively managing your accounts.
Gaining a Proactive Edge with Dashboards
Picture a Customer Success Manager starting their day. Instead of sifting through endless spreadsheets, they open a dashboard that instantly flags the health of their entire client portfolio. In seconds, they can spot which clients have low health scores, who isn’t using key features, and which accounts have support tickets piling up.
Here’s an example of what that kind of centralized dashboard might look like, giving you a quick visual summary of key client health indicators.
This at-a-glance view lets the CSM prioritize their day based on actual data, focusing their energy where it’s needed most.
The big takeaway here is that technology gives your team the power to get ahead of problems before they escalate. Automated alerts can flag a risky account the second its product usage dips, allowing your team to step in long before the client even thinks about churning. That proactive stance is what separates a good customer-focused strategy from a great one.
Specialized Tools for Specific Needs
While a platform like Chatiant is fantastic for getting that holistic view of client health, sometimes you need to go deeper. For agencies handling client ad campaigns, for example, a general CS platform might not have the firepower needed for detailed campaign analysis.
In these situations, specialized tools can fill the gaps with more granular insights. For instance, you might use dedicated PPC management software for agencies to track ad performance, which is a significant piece of a client's success puzzle. The real magic happens when you integrate the data from these specialized tools back into your main CS platform, creating a truly complete picture of the client relationship.
The whole point of any tool is to turn raw data into actionable intelligence. Whether it’s an all-in-one platform or a niche solution, the right tech gives your team the insights to make smarter, faster decisions that boost retention and drive growth.
Common Mistakes to Avoid When Measuring Client Success
Tracking client success metrics can feel like a huge step forward, but collecting data is only half the battle. A lot of businesses fall into common traps that make their hard-earned numbers far less useful than they should be.
Learning to sidestep these errors from the start will save you a ton of time, resources, and headaches down the road.

One of the biggest mistakes is fixating on a single "vanity" metric. Sure, a high Net Promoter Score (NPS) looks great on a report. But if your customer churn rate is also high, you have a serious disconnect.
The NPS score tells you people like you, but the churn rate shows they aren't getting enough value to actually stay with you. That's a classic case of a metric telling a dangerously incomplete story.
Relying on Inaccurate Data
Another all-too-common problem is poor data quality. If your inputs are messy, your outputs will be meaningless. It’s that simple.
To make sure your client success metrics are reliable, you have to tackle data quality issues at the source. This includes things like fixing data entry errors that can completely skew your results and lead your team to make some really bad decisions.
A related issue is failing to act on the insights you gather. Data that just sits in a dashboard is worthless.
The purpose of tracking metrics is not just to report on the past, but to actively shape the future. Each data point should trigger a question: "What should we do differently because of this?"
For example, if you see a dip in product usage for a specific client segment, the next step isn't just to note it, it's to reach out to them. This proactive approach turns your data into a powerful retention tool and is a core part of the feedback loop we cover in our guide on how to improve customer satisfaction.
Ignoring Customer Segmentation
Finally, treating all your customers the same is a recipe for failure. A small business using your basic plan has completely different needs and success criteria than an enterprise client with a custom package.
When you don't segment your data by customer type, you can easily miss important trends.
You might find that while your overall churn is low, you're losing a high percentage of your most valuable enterprise accounts. Segmenting your metrics allows you to spot these specific problems and develop targeted solutions for each customer group, which is where the real wins happen.
Your Questions, Answered
Even with the best metrics in place, a few questions always pop up. Let's clear up some of the most common ones.
What Is the Single Most Important Client Success Metric to Track?
There’s no magic bullet that works for every single business. It really boils down to what you’re trying to achieve. But for most subscription-based SaaS companies, Net Revenue Retention (NRR) is king.
Why? Because it’s not just about keeping customers. NRR tracks both churn (who’s leaving) and expansion (who’s upgrading or buying more), giving you a crystal-clear picture of growth from the clients you already have.
How Often Should We Review Our Client Success Metrics?
It depends on what you're looking at. Leading indicators, like product usage stats or client engagement scores, should be on your radar daily, or even in real-time. These are your early warning signals.
Lagging indicators, like churn and NRR, are better suited for monthly or quarterly reviews. The key is to find a consistent rhythm that gives your team enough time to actually do something with the data they’re seeing.
What Is the Difference Between a Health Score and CSAT?
This is a great question, and it’s easy to get them mixed up.
A Customer Satisfaction Score (CSAT) is a snapshot. It measures how a client feels about one specific interaction, right after it happens, like closing a support ticket. Think of it as direct, in-the-moment feedback.
A client health score, on the other hand, is a predictive metric that you build. It pulls together multiple data points (product usage, support tickets, survey results, and even CSAT scores) to forecast how likely a client is to stick around or churn. In short, CSAT is one ingredient in the much larger recipe of a health score.
Ready to turn data into action? Chatiant helps you monitor client health and automate proactive outreach with custom AI agents and chatbots. Get started with Chatiant today.
Mike Warren
Porttitor pellentesque eu suspendisse porttitor malesuada odio tempus enim. Vitae nibh ut dui ac morbi lacus. Viverra in urna pretium hendrerit ornare enim mauris vestibulum erat.